Mean Sea Level Pressure & Wind Speed at 850 hPa
Contents
Mean Sea Level Pressure & Wind Speed at 850 hPa
Note: this notebook is lightly modified from an existing ECMWF notebook. See the original ECMWF notebook example.
Retrieve Data
This product takes in input 3 parameters :
In this example, we will use:
cdsapi Client to download the data
ecmwf.data library to read and process the data
magpye to plot the result
Load required libraries
import cdsapi
import ecmwf.data as ecdata
from magpye import GeoMap
[OPTIONAL] Specify URL and Atmosphere Data Store key
This step is optional as we have already downloaded the data for you.
URL='https://ads.atmosphere.copernicus.eu/api/v2'
KEY='######################################'
CAMS global atmospheric composition forecasts
[OPTIONAL] Retrieve CAMS global atmospheric composition forecasts from the Atmosphere Data Store
This step is optional as we have already downloaded the data for you. The following two code blocks have been commented out as a result.
Variables: Mean sea level pressure, 10m u-component of wind, 10m v-component of wind
Type: Forecasts
Resolution: 0.4 deg x 0.4 deg
'''
c = cdsapi.Client(url=URL, key=KEY)

c.retrieve(
    'cams-global-atmospheric-composition-forecasts',
    {
        'date': '2021-08-05/2021-08-05',
        'type': 'forecast',
        'format': 'grib',
        'time': '00:00',
        'variable': [
            'u_component_of_wind', 'v_component_of_wind',
        ],
        'leadtime_hour': '12',
        'pressure_level': '850',
    },
    './20210805_cams_forecast_wind850.grib')
'''
'''
c.retrieve(
    'cams-global-atmospheric-composition-forecasts',
    {
        'date': '2021-08-05/2021-08-05',
        'type': 'forecast',
        'format': 'grib',
        'time': '00:00',
        'variable': 'mean_sea_level_pressure',
        'leadtime_hour': '12',
    },
    './20210805_cams_forecast_mslp.grib')
'''
pl_filename = '../data/cams/2021/20210805_cams_forecast_wind850.grib'
sfc_filename = '../data/cams/2021/20210805_cams_forecast_mslp.grib'
Reading and processing the data
Now we can use ecmwf.data to read the files.
wind850 = ecdata.read(pl_filename)
msl = ecdata.read(sfc_filename)
The describe() function will give us the overview of the dataset.
wind850.describe()
| parameter | typeOfLevel | level | date | time | step | paramId | class | stream | type | experimentVersionNumber |
|---|---|---|---|---|---|---|---|---|---|---|
| u | isobaricInhPa | 850 | 20210805 | 0 | 12 | 131 | mc | oper | fc | 0001 |
| v | isobaricInhPa | 850 | 20210805 | 0 | 12 | 132 | mc | oper | fc | 0001 |
And an overview of one parameter, where we can see more information, such as units or type of level.
msl.describe('msl')
| shortName | msl |
|---|---|
| name | Mean sea level pressure |
| paramId | 151 |
| units | Pa |
| typeOfLevel | surface |
| level | 0 |
| date | 20210805 |
| time | 0 |
| step | 12 |
| class | mc |
| stream | oper |
| type | fc |
| experimentVersionNumber | 0001 |
We can use ls() function to list all the fields in the file we downloaded.
wind850.ls()
| centre | shortName | typeOfLevel | level | dataDate | dataTime | stepRange | dataType | gridType | |
|---|---|---|---|---|---|---|---|---|---|
| Message | |||||||||
| 0 | ecmf | u | isobaricInhPa | 850 | 20210805 | 0 | 12 | fc | regular_ll |
| 1 | ecmf | v | isobaricInhPa | 850 | 20210805 | 0 | 12 | fc | regular_ll |
In order to calculate the speed, we need to filter out u and v component and use the speed() function for the calculation.
u = wind850.select(shortName ='u')
v = wind850.select(shortName ='v')
speed = ecdata.speed(u,v)
speed.describe()
| parameter | typeOfLevel | level | date | time | step | paramId | class | stream | type | experimentVersionNumber |
|---|---|---|---|---|---|---|---|---|---|---|
| ws | isobaricInhPa | 850 | 20210805 | 0 | 12 | 10 | mc | oper | fc | 0001 |
Mean sea level pressure data has unites Pa, but we want to plot it in hPa, therefore we need to convert it.
msl /= 100
Plotting the data
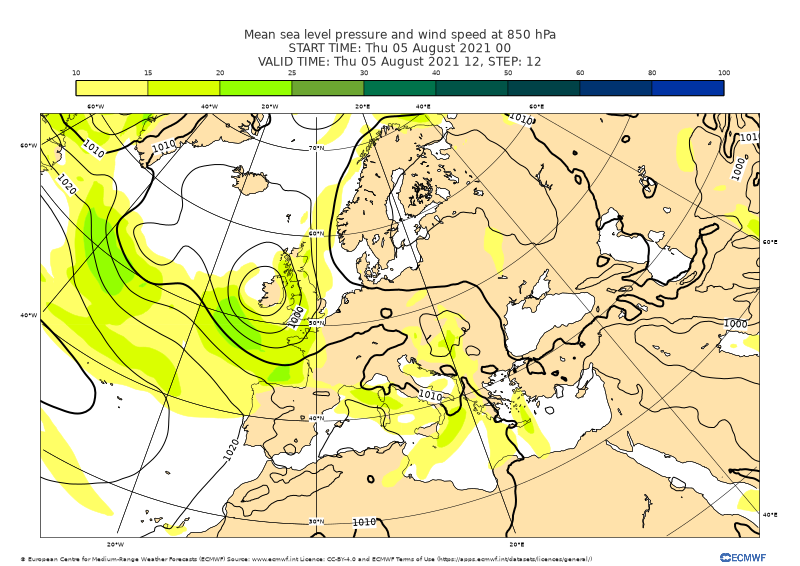
And finally, we can plot the data on the map.
fig = GeoMap(area_name='europe')

fig.coastlines(land_colour="cream",resolution="medium")

fig.contour_shaded(speed, style="green_speed")
fig.contour_lines(msl, style="black_i5")

fig.coastlines(resolution="medium")
fig.gridlines()

fig.title(["Mean sea level pressure and wind speed at 850 hPa",
           "START TIME: <grib_info key='base-date' format='%a %d %B %Y %H' where='shortName=msl'/> ",
           "VALID TIME: <grib_info key='valid-date' format='%a %d %B %Y %H' where='shortName=msl'/>, STEP: <grib_info key='step' where='shortName=msl' />"])
fig.legend()
fig.footer("© European Centre for Medium-Range Weather Forecasts (ECMWF) Source: www.ecmwf.int Licence: CC-BY-4.0 and ECMWF Terms of Use (https://apps.ecmwf.int/datasets/licences/general/)", logo='ecmwf')
fig.show()
References
Copernicus Atmosphere Monitoring Service Information 2021
The code in this notebook was adapted from the following sources:
origin: https://github.com/ecmwf/notebook-examples/blob/master/opencharts/medium-mslp-wind850.ipynb
copyright: 2020, ECMWF
license: Apache-2.0
retrieved: 2022-06-28 by Sabrina Szeto
Return to the case study
Assessing pre-fire risk with next-generation satellites: Mediterranean Fires Case Study
Mean sea level pressure and wind speed at 850 hPa