Forecasting pre-fire risk with next-generation satellites
Contents
Forecasting pre-fire risk with next-generation satellites
In the near future, new satellites such as Meteosat Third Generation (MTG) and Metop - Second Generation (Metop-SG) will provide advanced capabilities and valuable data for monitoring fires and their impacts. This three-part case study will introduce upcoming data products from MTG and Metop-SG in the context of the summer wildfires which occurred in southern Italy and Greece in early August 2021. In this part, we will introduce you to new capabilities in monitoring the pre-fire risk as part of the fire life cycle with data products from the Satellite Application Facility for Land Surface Analysis (LSA SAF), Global ECMWF Fire Forecast (GEFF) and the Copernicus Atmosphere Monitoring Service (CAMS) that will be improved with data from MTG and Metop-SG.
The Case Event
A long period of warm and dry weather led to fires breaking out across the Mediterranean during the summer of 2021. In the Mediterranean region, the winters are rainy and mild while the summers are hot and dry, leading to vegetation stress and the accumulation of fuels in the summer months.
In Greece, the largest wildfires occurred in Attica, Olympia, Messenia, and Evia (also known as Euboea). The fires in Evia, Greece’s second largest island, were particularly devastating. They led to two deaths and destroyed 125,000 hectares of land.
Southern Italy and Sicily were particularly impacted by wildfires. In Calabria, fires restarted in early August in the Aspromonte Mountain around the San Luca Valley, threatening ancient and primaeval beech forests (Faggete vetuste) that are recognised as a UNESCO World Heritage site.
Meteosat Third Generation (MTG)
MTG will see the launch of six new geostationary satellites from 2022 onwards. The satellite series will be based on 3-axis platforms and comprise: four imaging satellites (MTG-I) and two sounding satellites (MTG-S). The full operational configuration will consist of two MTG-I satellites operating in tandem, one scanning Europe and Africa every 10 minutes, and the other scanning only Europe every 2.5 minutes, and one MTG-S satellite.
EUMETSAT Polar System - Second Generation (EPS-SG)
The EPS-SG is a partnership programme, which involves the European Space Agency, the German Aerospace Agency and the National Center for Space Studies. The mission is composed of two series of spacecraft, Metop-SG A and B, flying on the same mid-morning orbit, like the current Metop satellites. The orbit height is in the range 823-848 km (dependent on latitudes). There will be three satellites each of Metop-SG A and Metop-SG B. The first two satellites Metop-SG A1 and Metop-SG B1 are planned to be launched in Q2 and Q4 2024 respectively. See here an overview of the planned launch dates.
Consisting of low earth orbiting satellites, Metop-SG will provide high spatial resolution imagery and data. However, they will only cover a smaller observation region and have a longer revisit period compared to geostationary satellites like MTG.
In this case study, we will be focusing on data products that are calculated using inputs from several instruments, namely Metop-SG’s METimage radiometer and MTG’s Flexible Combined Imager. While data from MTG and Metop-SG is not yet available, we will be introducing existing data products and explaining how new capabilities will arise from these upcoming satellites.
What is proxy data?
Proxy data refers to “data with valid scientific content, to be used in early training on instrument capabilities and application areas, for example in test beds. These are real datasets from relevant existing precursor instruments.” (Source: EUMETSAT)
Monitoring the fire life cycle consists of three stages: (1) pre-fire, (2) active fire and (3) post-fire. First, we can assess pre-fire risk based on meteorological and vegetation conditions. During the fire, we can detect and monitor the location of active fires as well as smoke being produced by the fires. Finally, after the fires have been extinguished, the burned area and burn severity can be assessed.
Normalised Difference Vegetation Index (NDVI)
Monitoring the greenness of vegetation is important as periods of dry and hot weather can lead to increased fire risk, as dry vegetation is easier to ignite and burn. A useful product is the 10-daily Normalised Difference Vegetation Index (NDVI) which is calculated using the red and near-infrared (NIR) surface reflectances. A high NDVI corresponds to greener vegetation that is less likely to burn. For this NDVI data product, each month is divided into three “dekads”. The first two always comprise ten days, while the third has a variable length, as it runs from day 21 until the end of the month. Figure 1 shows the NDVI anomaly for the last dekad of July 2021, calculated using a reference period between 2010 and 2020. Regions with low negative anomalies are colored in dark brown. These occur over areas that have lower NDVI, while positive anomalies colored in teal indicate regions that have higher NDVI than the reference period.
This NDVI data product is part of the LSA SAF data catalogue. LSA SAF develops and processes satellite products that characterise the continental surfaces, such as radiation products, vegetation, evapotranspiration and wildfires. At present, LSA SAF uses data from the Advanced Very High Resolution Radiometer (AVHRR) aboard the Metop satellites to calculate NDVI at a 1km spatial resolution. In the future, METImage data will be used, resulting in a higher spatial resolution of 500m.
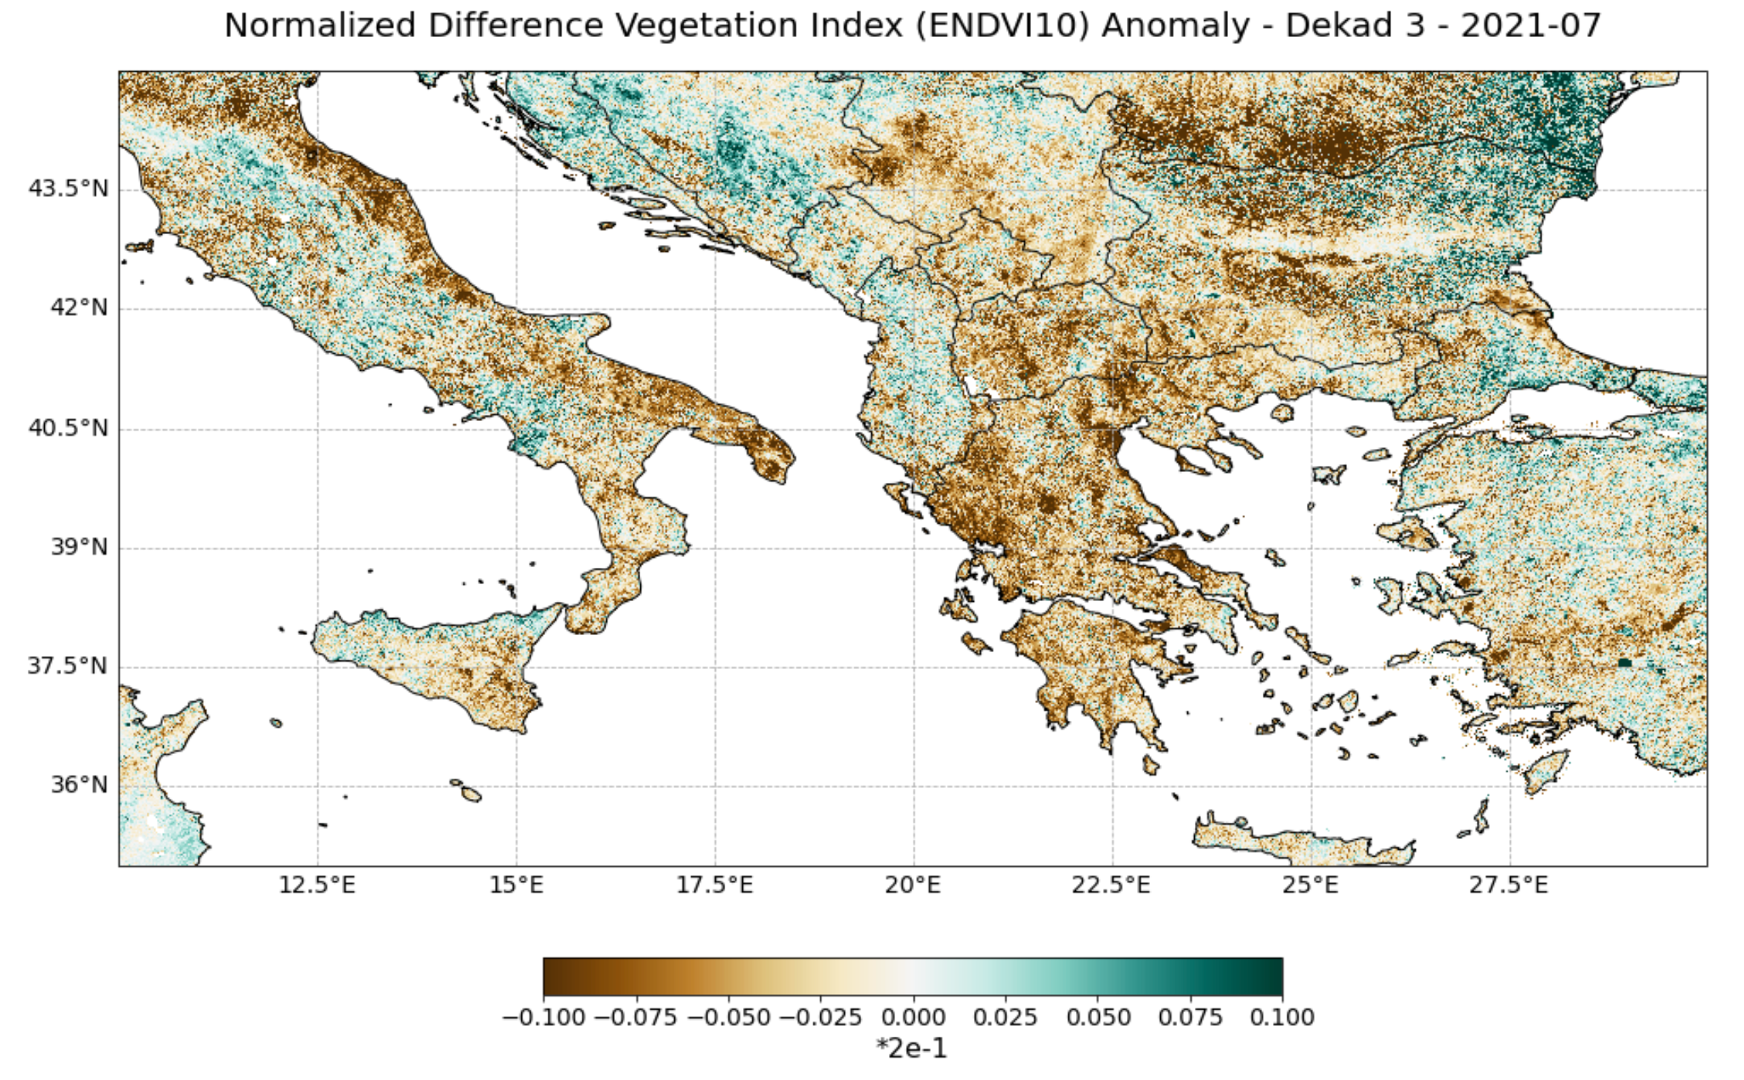
Figure 1. NDVI Anomaly for the last dekad of July 2021, as calculated with a reference period between 2010 and 2020.
Learn how this plot of NDVI was made.
Fire Risk Map: fire risk, fire probability and fire probability anomalies
Early information for fire risk is crucial for emergency response. One important source of information is the Fire Risk Map v2 (FRMv2), which consists of daily forecasts of classes of meteorological fire danger over Mediterranean Europe. Five fire risk classes are provided, ranging from low to extreme risk. The forecast timesteps available start at 24 hours to 120 hours. Figure 2 shows the fire risk map over Italy and Greece for 5th August 2021. The forecast data was retrieved with a 24 hour time step from 4th August 2021. Greece is mostly coloured in dark red, showing extreme fire risk. Italy has multiple areas coloured in orange which indicates high fire risk or bright red for very high fire risk.
Currently, this dataset is based on LSA SAF data records of daily released energy by active fires derived from Meteosat Second Generation’s SEVIRI instrument. In the future, data from Flexible Combined Imager (FCI) aboard the MTG satellites will be incorporated into fire risk mapping. The FCI provides 16 channels in the visible and infrared spectrum with a spatial sampling distance in the range of 1 to 2 km and four channels with a spatial sampling distance in the range of 0.5 to 1 km. The increased spatial resolution of FCI will allow the detection of less intense fires than with the current SEVIRI pixel size. Also the dynamic range of the middle infrared FCI channel will be enhanced, avoiding pixel saturation for very intense fires. The quality of the FRMv2 product will be improved through better calibration.
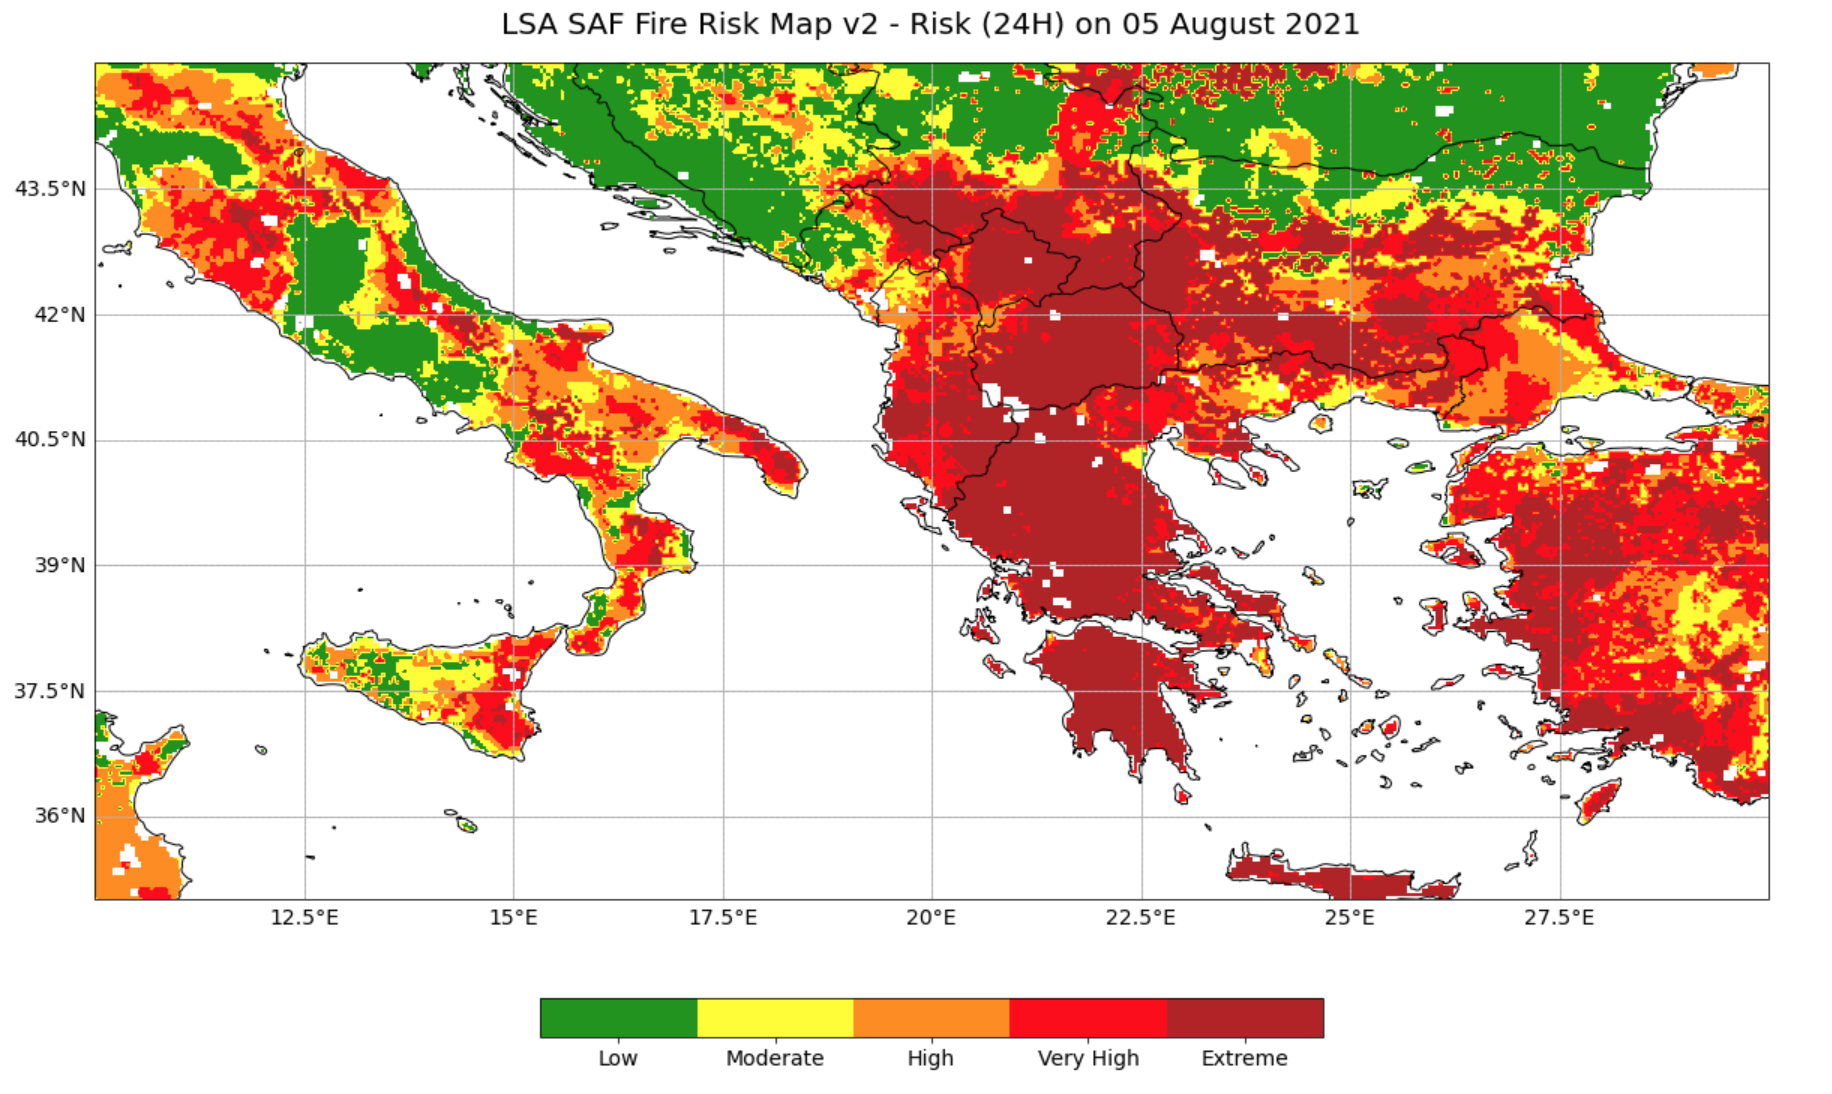
Figure 2. 24-hour forecast of fire risk for 5th August 2021 from LSA SAF.
Learn how this plot of Fire Risk Map was made.
Probabilities of a Potential Wildfire exceeding 2000 GJ of Daily Energy released by Fires (P2000)
Another data variable available within the FRMv2 dataset is P2000, which shows the probabilities of a potential wildfire exceeding 2000 GJ of daily energy released by fires (P2000). In other words, it provides information on the likelihood of a potential wildfire getting out of control. Figure 3 shows the 24 hour forecast of P2000 for 5th August 2021. Greece is mostly coloured in orange and red, indicating a high probability of a potential wildfire getting out of control. Italy is mostly coloured in blue and green, indicating lower probabilities of a wildfire getting out of control.
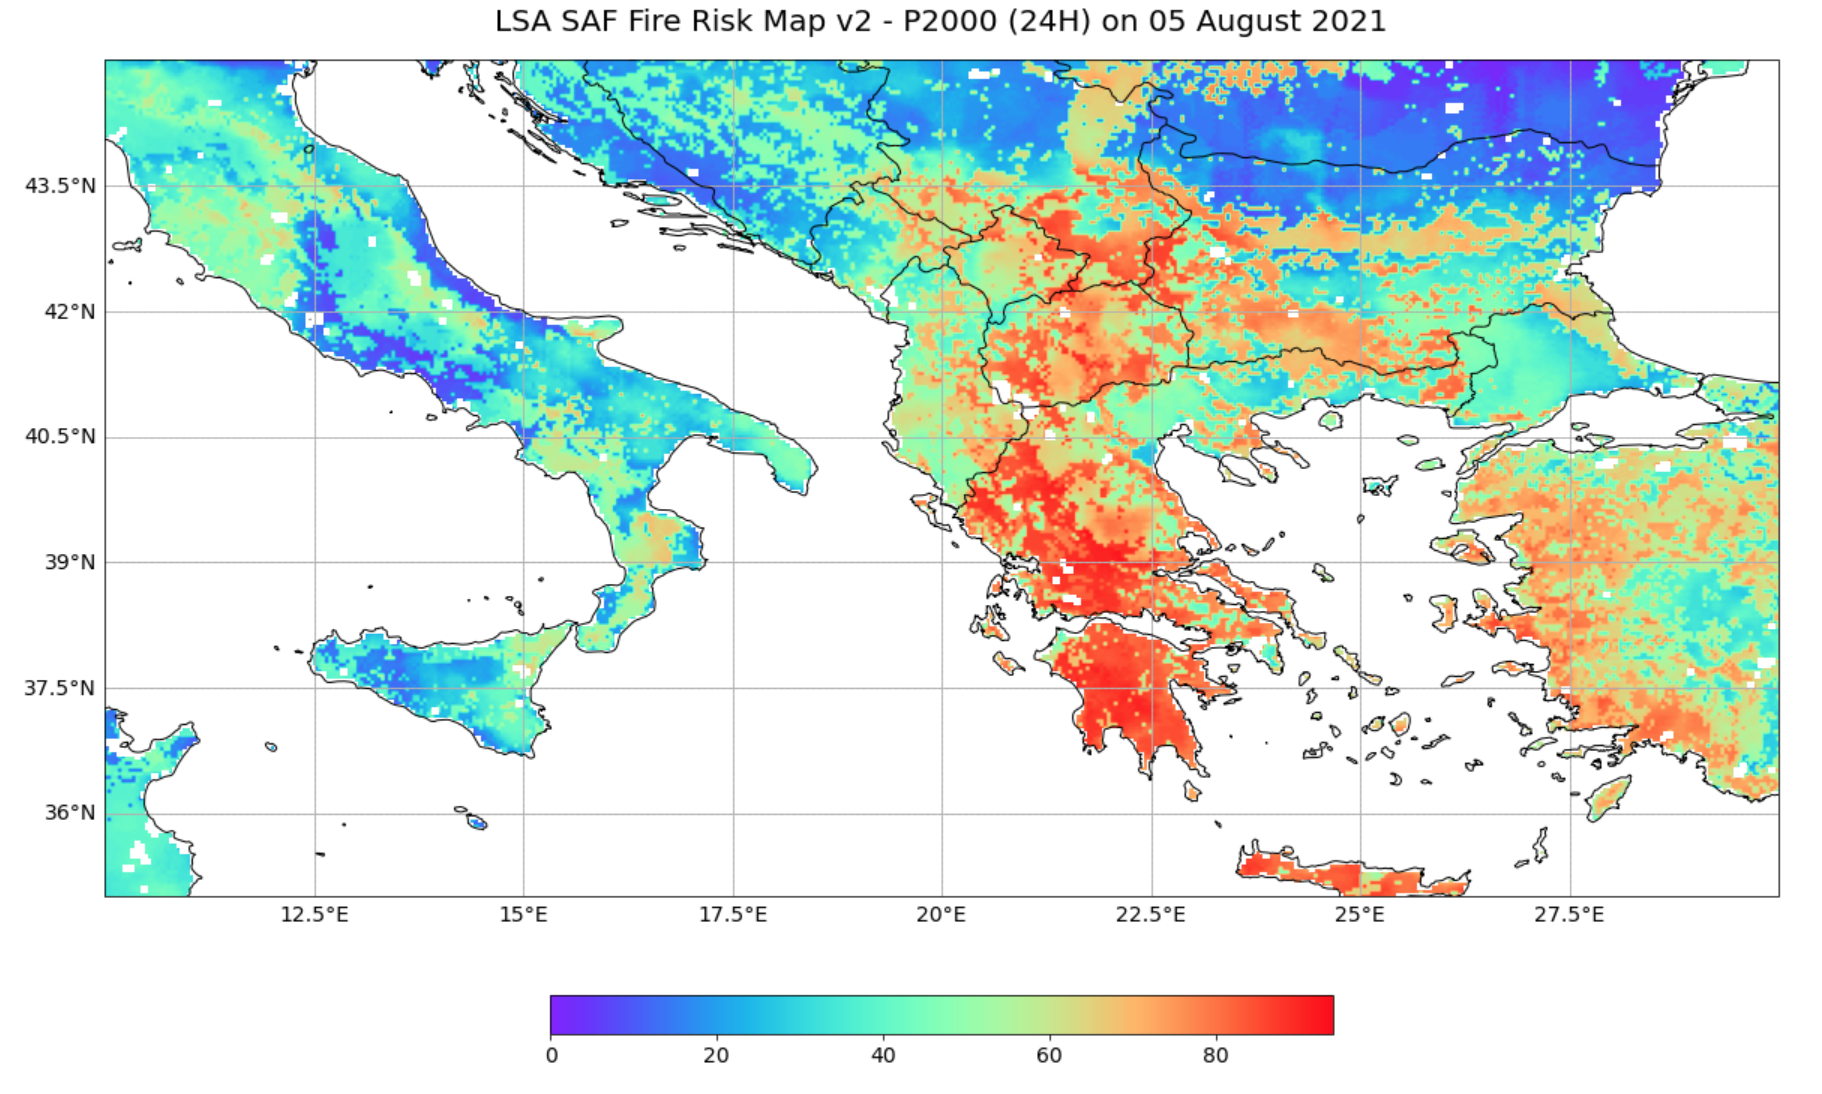
Figure 3. 24-hour forecast of the probability of fire emitted energy being above 2000 GJ for 5th August 2021 from LSA SAF.
Learn how this plot of P2000 was made.
24 hour forecast of the anomaly of probability of exceedance of 2000 GJ of daily energy released by fires (P2000a)
Figure 4 shows the 24 hour forecast of the anomaly of probability of exceedance of 2000 GJ of daily energy released by fires (P2000a) for 5th August 2021. This quantity is computed at each pixel as the deviation of the probability of exceedance for a given pixel and a given day of a given year from the average of all values of probability of exceedance for that pixel and day over the period 1979–2016. Greece is mostly coloured in dark and light red, indicating that there is a positive anomaly for the probability of a potential wildfire getting out of control. Southern Italy is also mostly coloured in light red. This means that it is more likely than usual for a fire to burn out of control in both countries.
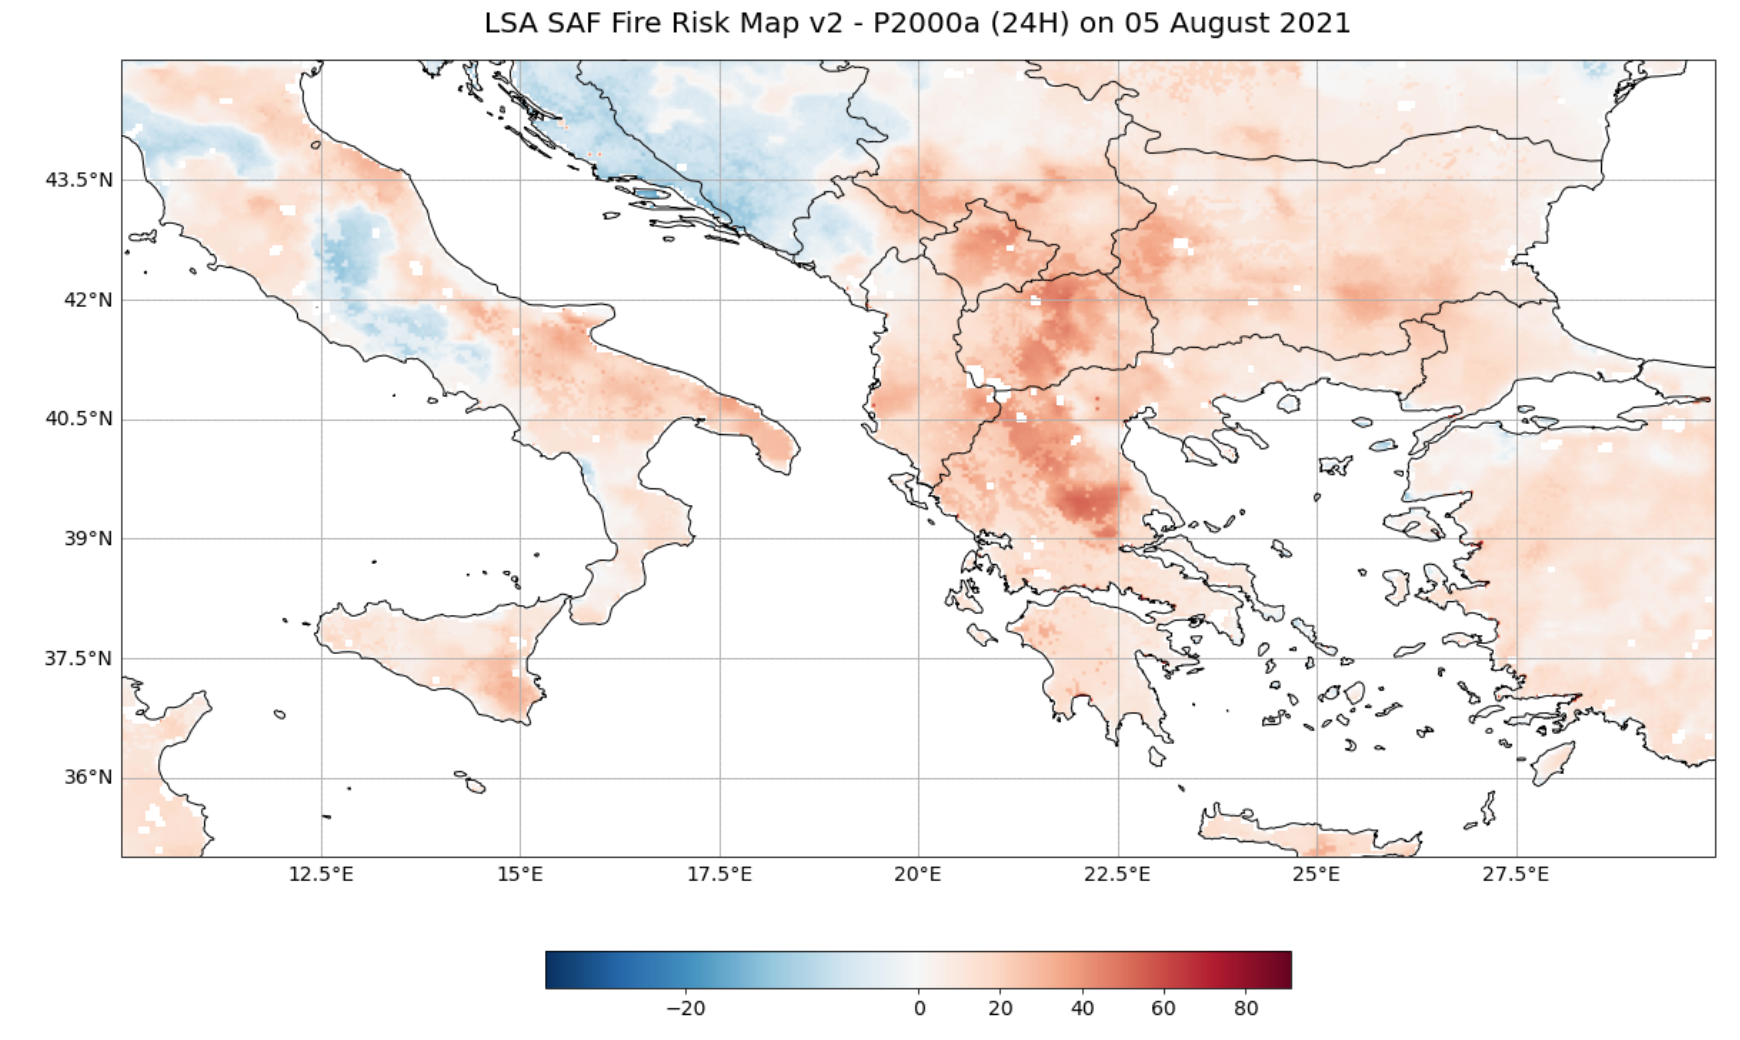
Figure 4. 24-hour forecast of the anomalies of the probability of fire emitted energy being above 2000 GJ for 5th August 2021, from LSA SAF.
Learn how this plot of P2000a was made.
Fire Weather Index
The European Centre for Medium-Range Weather Forecasts (ECMWF) produces daily fire danger forecasts and reanalysis products for the Copernicus Emergency Management Services (CEMS). The modelling system that generates the fire data products is called Global ECMWF Fire Forecast (GEFF) and it is based on the Canadian Fire Weather index as well as the US and Australian fire danger systems. As GEFF uses CAMS data for modelling, both GEFF and CAMS will benefit from the inclusion of the higher spatial, temporal and radiometric resolution of the future data from MTG and EPS-SG.
Figure 5 shows the GEFF Fire Weather Index (FWI) for 5th August 2021 as classified using European Fire Danger Classes. While the FWI values are continuous, Figure 5 groups them into fire weather categories ranging from very low (green), low (yellow), moderate (orange), high (red), very high (brown) to extreme fire danger (black). Greece and Italy both have areas that have very high and extreme fire danger. Learn how this fire weather index plot was made.
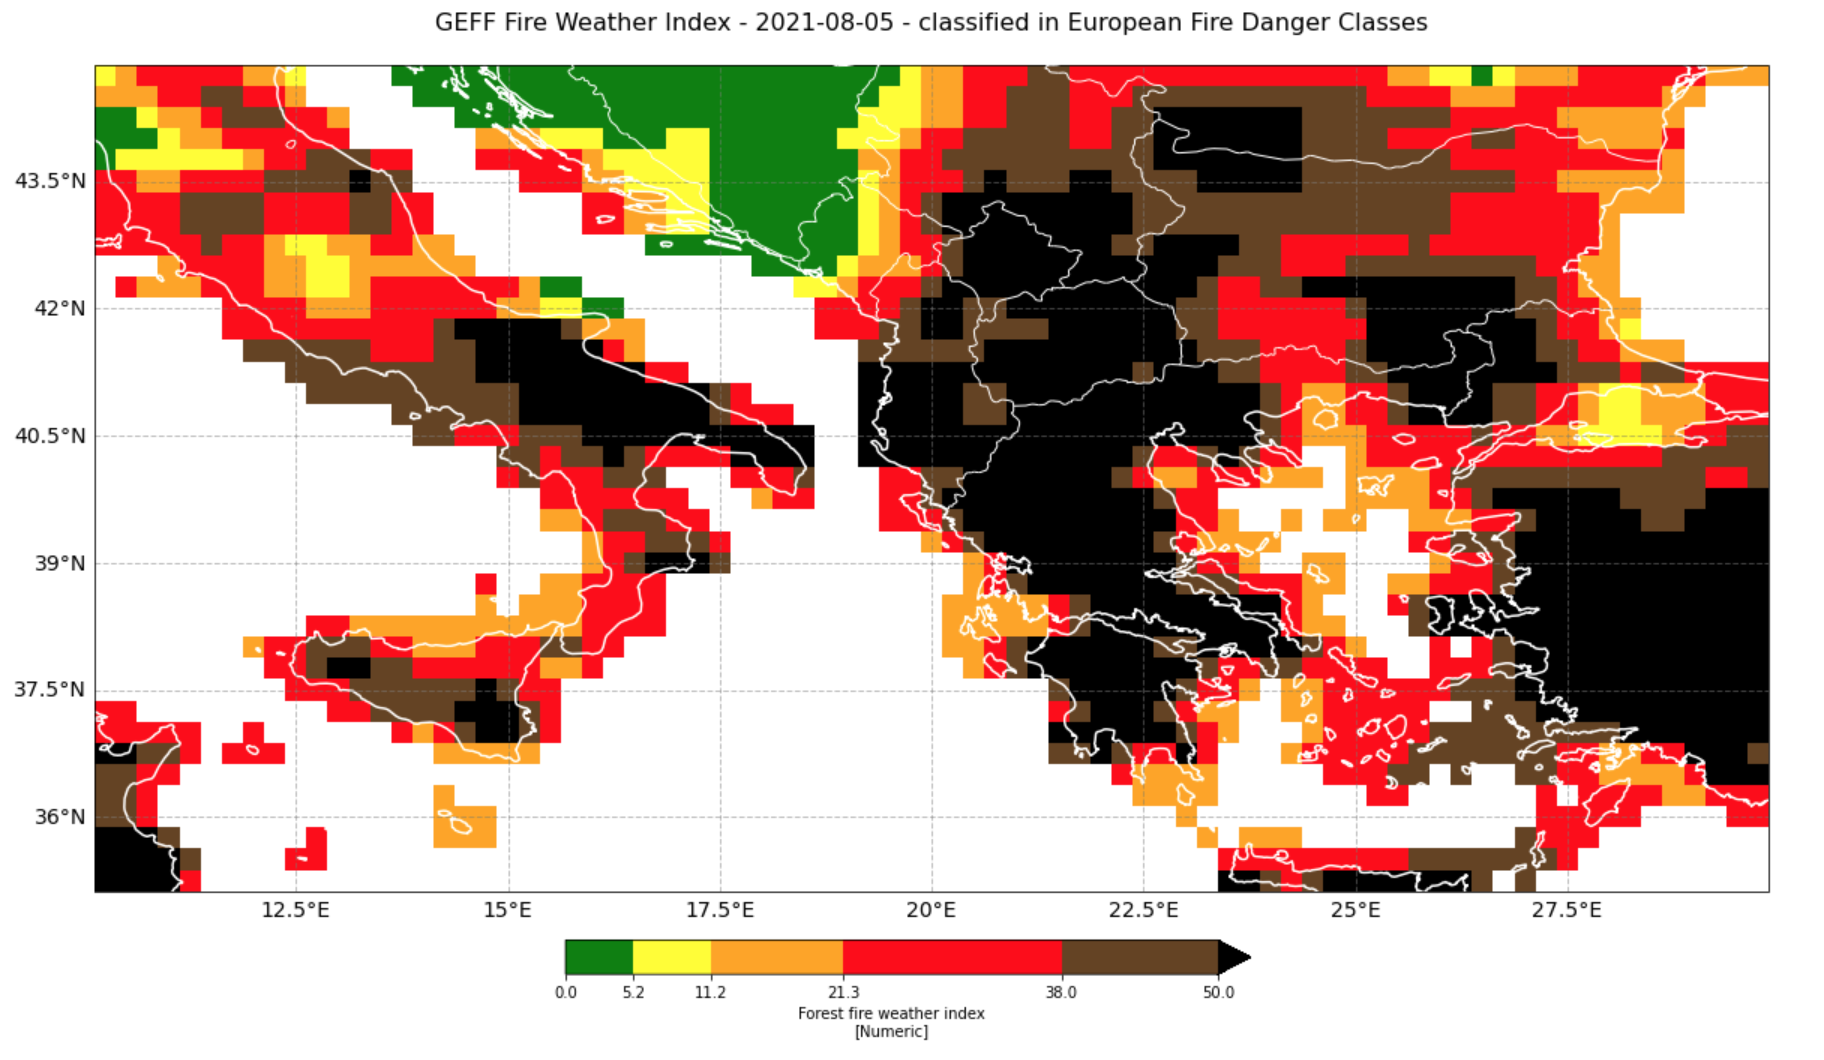
Figure 5. The GEFF Fire Weather Index for 5th August 2021 as classified using European Fire Danger Classes.
Learn how this fire weather index plot was made.
Mean sea level pressure and wind speed at 850 hPa
The mean sea level pressure (MSLP) and wind speed at 850 hPa from CAMS are useful for assessing fire risk, ignition conditions and direction of fire spread. According to ECMWF, “Maps of mean sea level pressure are used to identify the locations of low and high pressure systems, often referred to as cyclones and anticyclones. Contours of mean sea level pressure also indicate the strength of the wind. Tightly packed contours show stronger winds.”
15-day forecast data for MSLP and wind spread is available via ECMWF Charts. To visualise these data variables for 5th August 2021, Figure 6 uses CAMS Global Atmospheric Forecast data instead. The wind speeds over Italy and Greece are between 10-15 m/s which could support the development and spread of fires. The mean sea level pressure is around 1010 Pa.
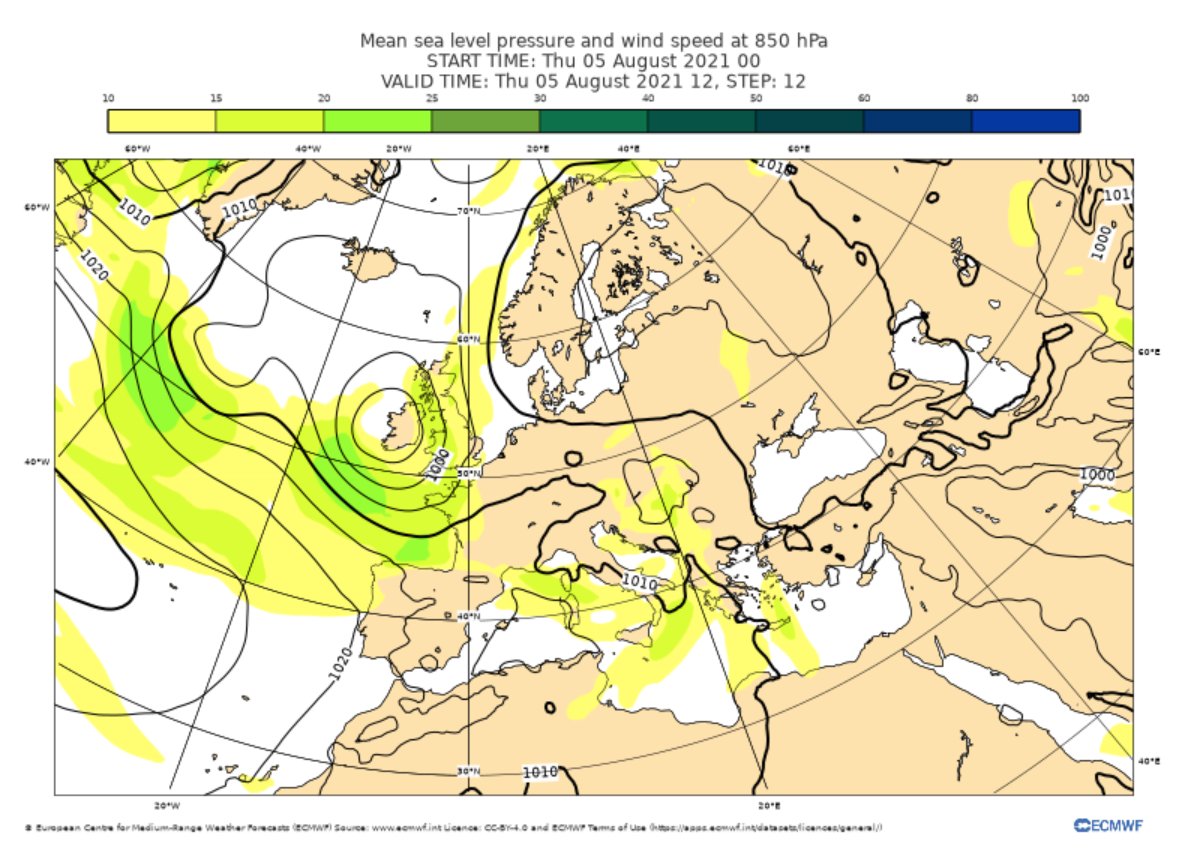
Figure 6. Mean sea level pressure (MSLP) and wind speed at 850 hPa from CAMS Global Atmospheric Forecasts from 5th August 2021.
Learn how these plot showing MSLP and wind speed at 850 hPa were made.
References
Trigo, I. F., C. C. DaCamara, P. Viterbo, J.-L. Roujean, F. Olesen, C. Barroso, F. Camacho-de Coca, D. Carrer, S. C. Freitas, J. García-Haro, B. Geiger, F. Gellens-Meulenberghs, N. Ghilain, J. Meliá, L. Pessanha, N. Siljamo, and A. Arboleda. (2011). The Satellite Application Facility on Land Surface Analysis. Int. J. Remote Sens., 32, 2725-2744, doi: 10.1080/01431161003743199
Copernicus Atmosphere Monitoring Service Information 2021